TROCAS Data and Data Processing
Contents
TROCAS Data and Data Processing
Describe what this section will be about. Data and computation
All data vs Underway (focus here)
Underway Data
Initial efforts have focused on continuous underway data generated by sensors, specifically GPS, EXO multi-parameter water quality sonde, Licor CO2 analyzer and Picarro CO2 and CH4 isotope and gas concentration analyzer.
Data from the 8 campaigns have been processed, from April 2014 through November 2019.
Data Processing
Data tools & products (software, including Jupyter Notebooks)
Scripts to process underway sensor raw files
Scripts to create merged 1-minute binned files
Mention the TROCAS data browser
Compilation and processing of raw sensor data files
Add subheadings in this section, if I’m going to keep all this text
The underway files in the data folder Google Drive cloud storage Underway and were processed into workable datastreams.
Jupyter notebooks were developed in Python for processing the raw data from each sensor into standardized tidy data aggregating all transects and stored in Parquet files, an open, scalable, cloud-optimized format. The Jupyter notebooks capture a reproducible, transparent workflow that can be updated and rerun as needed to reprocess all the raw data as issues are addressed, enhancements are developed, and missing files are integrated.
Raw sensor output files (including GPS) were compiled and organized. These data were averaged into 1-minute bins and joined across sensors on the temporal bins to create a merged Parquet file. The binned data from each sensor are then joined on matching time-interval bins. Sensor data that don’t have a corresponding GPS 1-minute bin are not presented on this application; such data will require further investigation to attach geospatial coordinates. These per-sensor tidy data frames are available to the team for analysis and further quality control, and subsequently for integrated analysis and exploration.
Processes for clearly separating underway data along spatial trajectories from fixed-site diel time series are also being developed. Source sensor data files in parent folders indicating their sampling “type” as underway (moving) or diel (stationary) are flagged as such in data processing workflow. All others are labelled with a default mixed (unknown or a combination of the two) flag. The “stations - diel files” points represent aggregations of diel-flagged files, identified for further investigation and identification.
Currently nearly 1,200 individual sensor output files have been processed, encompassing nearly 100 million individual observations with accompanying automatically generated metadata and data inventories. In order to enable the team to readily explore these large datasets, the merged, 1-min-binned analysis-ready data are pushed to the cloud-based Heroku platform, in the Integrated folder. The actual Data Browser is a Python data exploration dashboard has been developed using the open-source HoloViz/Panel Python packages. This web-based dashboard is also pushed to the Heroku cloud platform for team access.
Data Browser
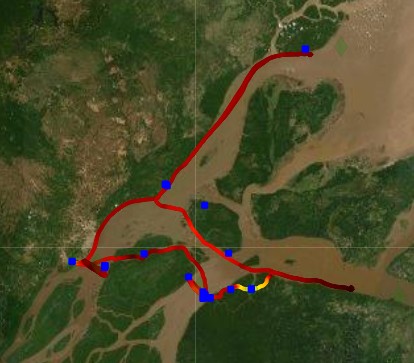
The TROCAS Data Browser provides convenient overviews and exploration of TROCAS data. Currently it aggregates underway sensor data from the TROCAS project across all TROCAS transects conducted so far and collected from a boat in continuous “underway” mode while transiting or remaining stationary at a location. See the TROCAS Data Browser for access and additional technical information.
Data storage and access
Data produced
on S3 (parquet). Include the AWS bucket name, links to current parquet files (but not intended to be exhaustive), and info about requesting access (first confirm it’s not currently set to anonymous, public access)
on Google Drive
Mention Team Access page for access to private-access data; link to it
Our open resources on GitHub
We use the GitHub online platform for collaborative software and document development in order to enable open team collaborations on data procesing software and workflows and share much of these resources broadly. Our GitHub resources are found at https://github.com/amazon-riverbgc/. Currently we host the following as public repositories:
TROCAS web site content. https://github.com/amazon-riverbgc/TROCAS/
TROCAS Data Browser code. https://github.com/amazon-riverbgc/trocas-herokuapp1
Other resources will be added and released in the future, starting with the Python code used for processing raw underway data files into the integrated, intermediate data products used in the Data Browser.
TEXT TO DRAW FROM
From SITr doc Feb ‘22.
Underway data
The continuous, underway measurements of CO2, CH4 together with temperature, dissolved oxygen and O2 and utilizing the Licor, Exosonde, Picarro and GPS sensors will allow high resolution insight into how the dynamics of the biogeochemistry of a parcel of water evolves as that parcel advects downstream. Composition varies according to distance traveled, lateral exchanges, biological processes, turbulence, and tides.
To organize and process these complex data sets capable of addressing these issues, a series of data tools were developed. While these tools are currently focused on the underway data, the intent is that they are adapted to the other data streams.
A major data challenge is to be able to ‘see” all of the complicated data we have, including of getting coordinates, values etc synchronized and plotted. To that end, Emilio has designed and implemented a sweet data browser, first for the underway data. The structure of the browser is to maximize flexibility. https://trocasdata-1.herokuapp.com/trocas_pannelapp_1
About Data Browser
The functionality of this dashboard is being regularly refined and expanded. In addition, in the near future both processed and merged Parquet files will be deployed to object storage on the Amazon AWS S3 cloud for more flexible access via cloud-based computation in Python and R Jupyter notebooks leveraging the cloud-based Pangeo (https://pangeo.io) geoscience Big Data platform. Other data collected by the team will be addressed in upcoming phases, including ADCP sensor data, biogeochemical analyses from samples, incubation experiments and ‘omics data, lowering barriers for integrated analysis of environmental and ‘omics data. This capability will build on the team’s experience with cyberinfrastructure interfacing environmental and ‘omics data, particularly via persistent and globally unique International GeoSample Numbers (IGSN) and Environmental Package metadata that is part of the Genomic Standards Consortium Minimum Information about any (x) Sequence (MixS) standard. Such integration and production of analysis-ready data will enable future machine-learning applications.
